Today, entrepreneurs have access to more data than ever before. But understanding this data and leveraging it to grow your business can be a difficult challenge. This is where Looker Studio Gallery of Databloo plays an important role.
To be clear, Looker Studio (formerly known as Google Data Studio) is a free data analysis tool that allows users to create custom reports and dashboards.
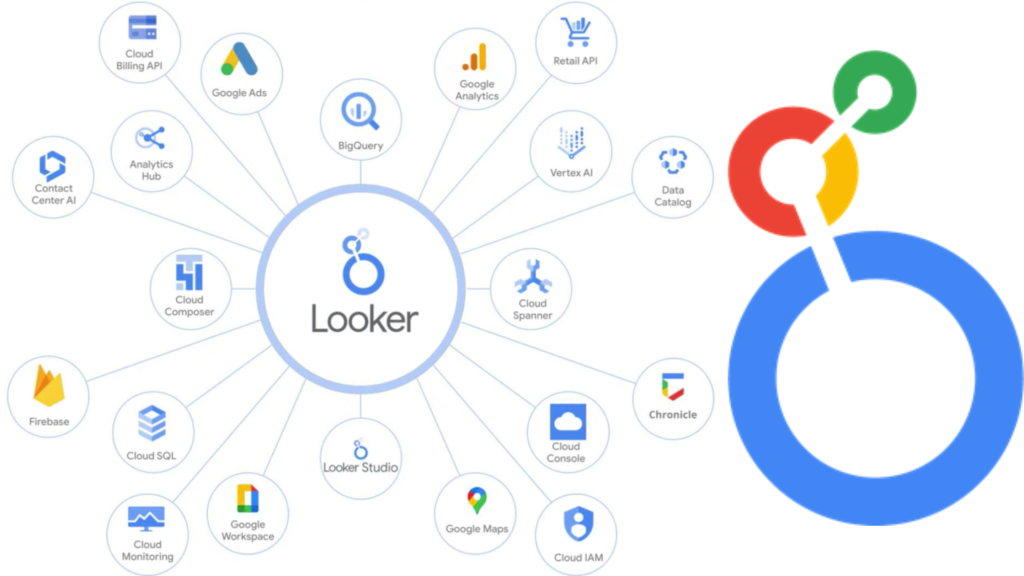
The most critical integrations of Looker Studio include popular platforms such as Google Analytics, Google Ads, and the search console, as they allow easy visualisation and analysis of data related to traffic, campaigns and organic searches. In addition, integrations with Facebook Ads, YouTube Analytics and various e-commerce platforms offer in-depth business intelligence. With these connections, users can pull data from multiple sources and create comprehensive reports to make more targeted decisions.
However, creating from scratch can be time-consuming and complicated for the average entrepreneur.
With the Looker Studio Gallery of Databloo, entrepreneurs can choose from a collection of ready-made and professionally designed templates. These templates help to directly understand key metrics and indicators to improve decision making and grow their business.
How can a dashboard help?
Saving time
Databloo's custom dashboards offer ready-made solutions for data analysis, without the need for technical knowledge. Business leaders can focus on what's important: decision making. Below are a few examples:

- Automated reports: Instead of manually generating reports every week or month, you can program Looker Studio to automatically update your data in real time.
- Gathering data from multiple sources: With integrations from Google Analytics, Google Ads, Facebook Ads, etc., you don't have to go into each platform individually. All data is presented in a single dashboard.
- Direct data visualisation: No need to manually create charts or tables in Excel. Looker Studio allows you to create visual representations of data with just a few clicks, making analysis easier.
- Sharing of reports: You can share live, up-to-date reports with your team or customers via links, without having to send separate reports every time there's a new update.
Data visualisation
With the right graphs, data becomes easier to understand and easier to manage. Whether it's financial data, sales data or marketing performance data, it's all displayed in a way that allows for immediate action.

- Custom graphs and tables: You can create interactive graphs, pies, bars or timelines that present your data in a simple and understandable way.
- Using filters: Users can add filters to reports to filter data by category, date or location. This enables more specific and targeted analyses.
- Heatmaps (heat maps): For measuring ad performance or traffic, heat maps provide an immediate visual understanding of the areas that have the most interaction.
- Real-time updates: Reports can be updated in real time, enabling you to see the current view of the business without having to create new reports every time.
- Interactive dashboards: You can create dashboards with multiple screens and interaction capabilities (e.g. date or data source selection), giving the user the opportunity to examine the data of interest in greater detail.
Custom Insights
Each standard is designed for specific sectors or needs. So you can choose the template that best suits your business.

- Customized performance indicators (KPIs): You can define specific performance indicators, such as sales per product, campaign performance or cost per conversion, to get an immediate picture of how the key areas of your business are performing.
- Calculated fields: Looker Studio allows you to create calculated fields using mathematical expressions. For example, you can calculate customer acquisition cost (CAC) or return on investment (ROI) to get a more meaningful understanding of your data.
- Comparisons of time periods: You can create reports that compare performance over different time periods, such as current month sales vs. previous month or campaign performance by year, to identify trends and adjust your strategy.
- Combining data from multiple sources: Looker Studio allows you to connect data from different platforms, such as Google Analytics, Facebook Ads and Google Ads, enabling you to create overall insights that integrate different aspects of the business.
- Alarms and automated insights: You can create dynamic reports that alert you when a KPI falls below a certain threshold or when there are significant changes in data trends.
Trend identification
Through dashboards you can easily identify positive or negative trends in your business, which will allow you to make timely decisions.

- Graphs over time: You can use line graphs that show the evolution of your data over time, such as sales, website traffic or conversions. This allows you to see if there is an upward or downward trend.
- Comparisons of periods: With the period comparison feature, you can see how your data performs compared to previous time periods (e.g. current month compared to the previous month or the same period of the previous year). This helps you monitor whether your strategy is performing better or worse.
- Rise/fall indicators (Sparklines): With small graphs next to KPIs such as sales or profits, you can instantly see if there is an upward or downward trend without having to analyse the data in detail.
- Custom thresholds (thresholds): You can set thresholds for specific indicators and receive alerts or display indicators if your trends exceed or fall below these thresholds, helping you to react quickly to changes.
- Gathering data from multiple sources: By combining data from different sources, such as Google Analytics and Facebook Ads, you can see trends across multiple platforms at once, giving you a complete picture of your business performance.
5 of Databloo's most popular Looker Studio Templates
We have collected for you the 5 most popular templates of Databloo and present them to you:
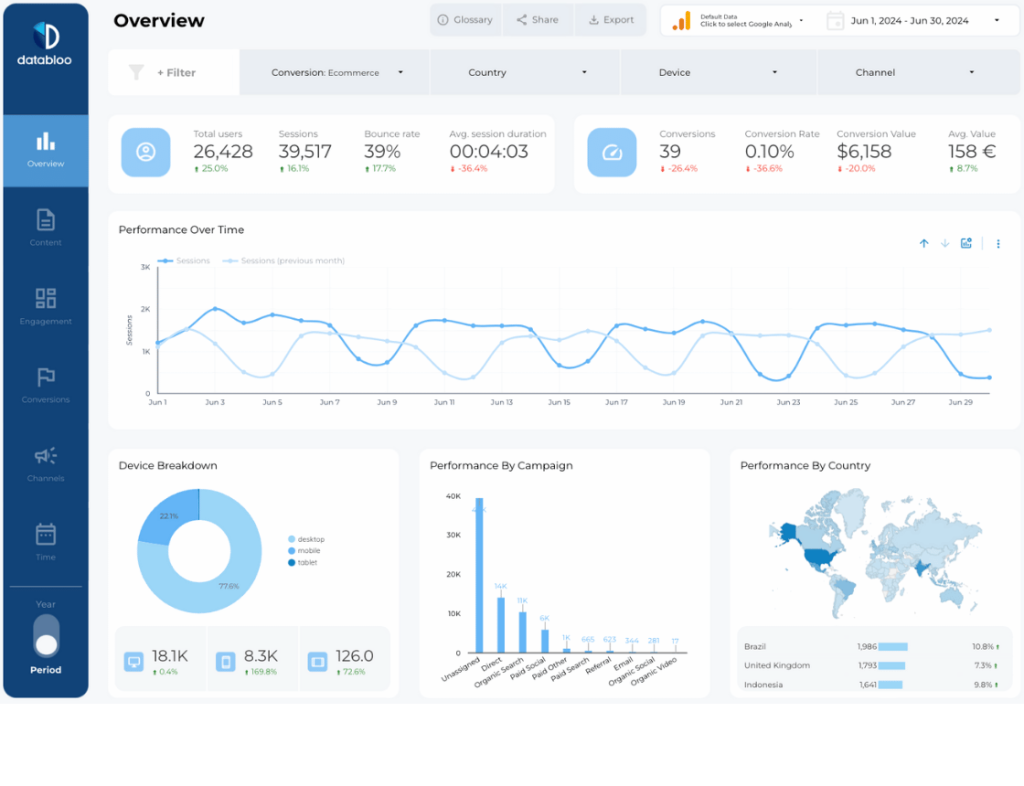
Google Analytics 4 (GA4) Template
This template provides a complete picture of your website traffic, including visitors, their behaviours and sources of origin. Especially for e-shops owners or websites with a large number of users, this template is ideal for understanding audience behaviour.
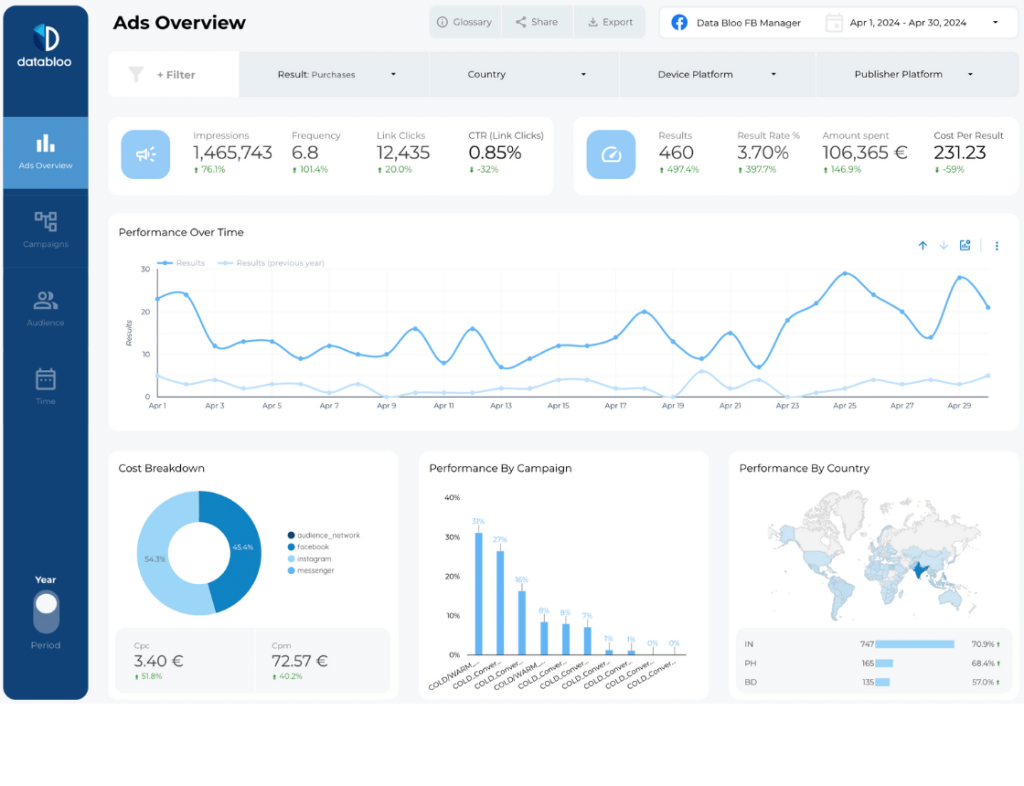
Facebook Ads Performance Report
If you're running Facebook campaigns, this template is a must. Improve the performance of your Facebook ads with the report of Looker Studio, providing information on ad, campaign and budget effectiveness, audience demographics and time trends. This report uses a free login to access your Facebook Ads data.
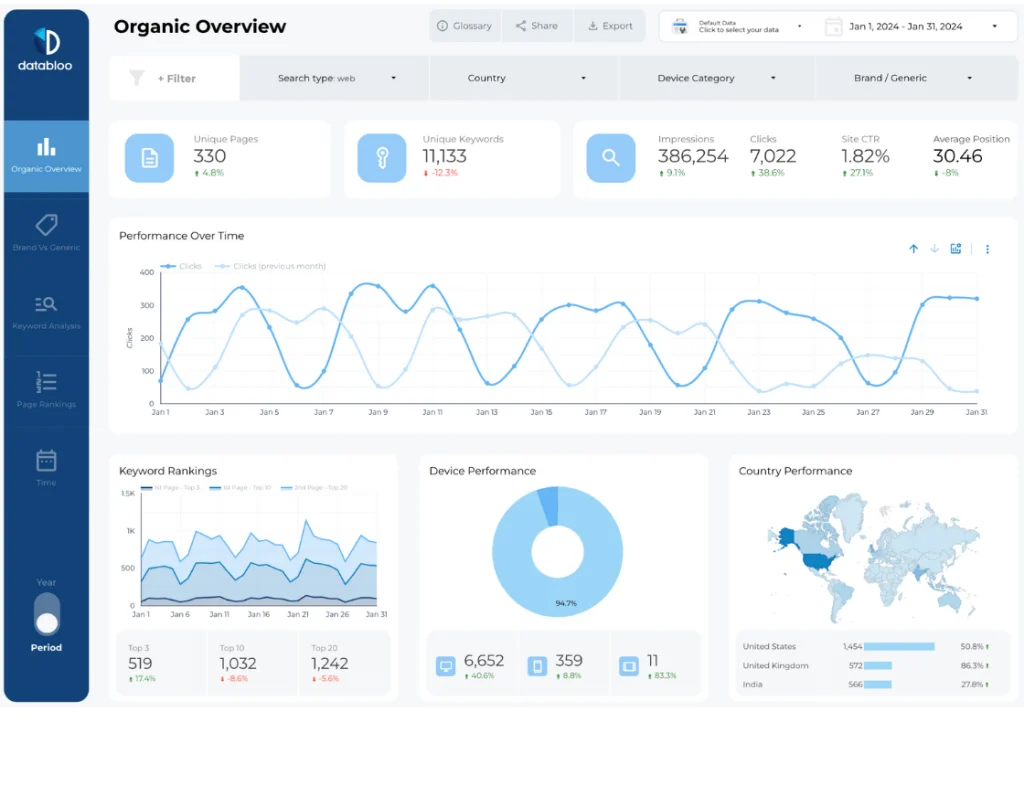
SEO Performance Dashboard
This template is specifically designed for businesses that focus on SEO. It shows keyword rankings, organic traffic and other key SEO indicators to help you understand if your strategies are working. So you can improve the performance of your organic searches. Designed to provide you with basic information about your data in Google Search Console, this template will help you understand your SEO performance and identify areas to improve your strategy.
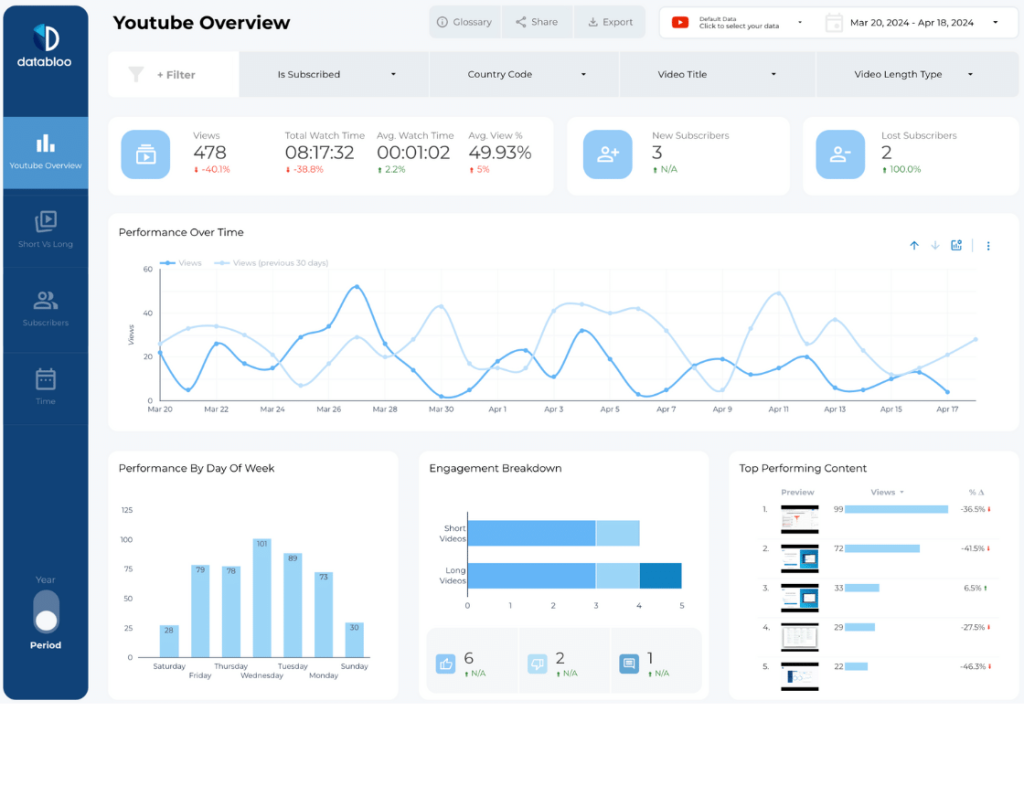
YouTube Channel Performance
If your business uses the YouTube as a means of communication or sales, this template gives you all the necessary data, from the overall performance of your videos to audience interaction.
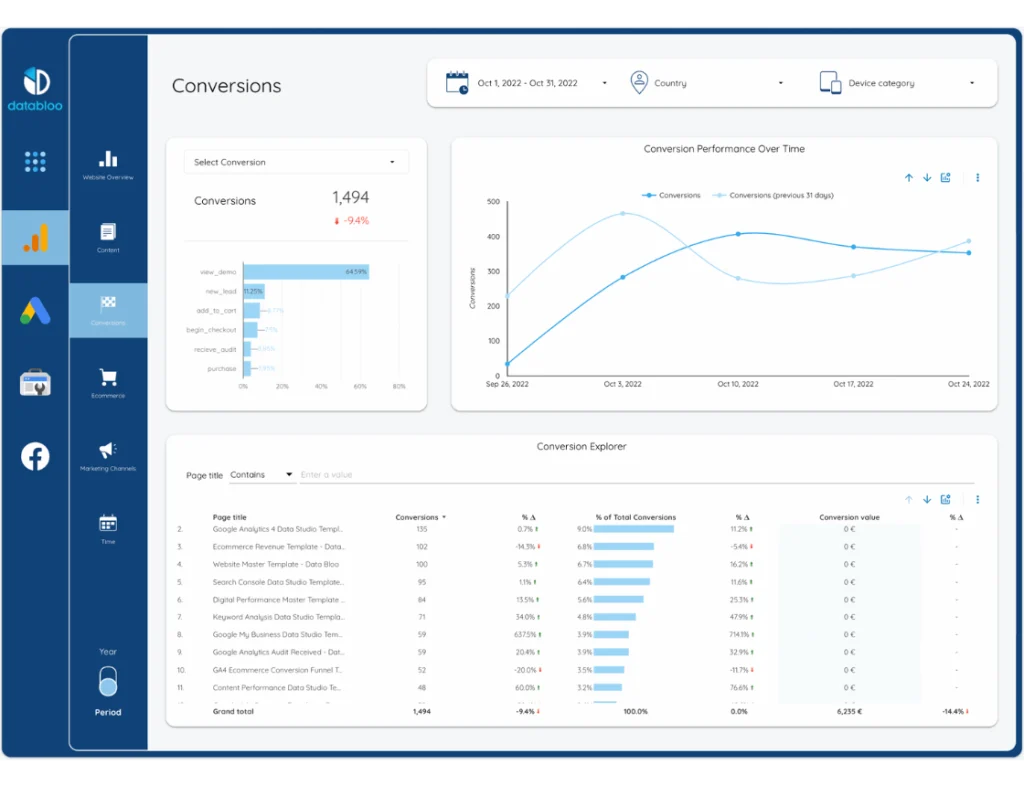
e-commerce dashboard
This standard is a complete solution for e-commerce stores. It includes all the sales, orders, revenue and other KPI data that e-shop owners need to make smart decisions. Get a holistic view of your digital marketing efforts with our easy-to-use multi-channel reporting that integrates GA4, Search Console, Google and Facebook in one place. The Looker Studio template includes website analysis, ecommerce reporting, organic search and Google and Facebook ads.
Cost Templates
At the time of writing this article prices start from 69€. But at this price count that you can reuse the template as many times as you want. It's not just for 1 use.
Free Google Analytics 4 Audit
Do you trust your GA data? Ask us a free Google Analytics 4 check for free and improve the quality and accuracy of your data in 25+ categories. Get instant results in less than 4 seconds to address issues in your account that may affect your decision making.
To be clear, Looker Studio Gallery well, it's not just a collection of templates. It is the tool that every modern entrepreneur should use to better understand their business and improve their strategies based on accurate data. With customized and easy-to-use dashboards, data management becomes more efficient and immediate, enabling faster decision-making.
Improve your reports and take your business to the next level with Databloo's custom templates!